ProblemMarine observations need QA, missing-data handling and time-scale normalization before model output can become an interpretable risk signal.DecisionConnect resampling, missing-data strategies, validation, caching, risk thresholds and exports in one analysis workflow.EvidenceThe repository verifies 5 time scales, 4 missing-data strategies and 4 exports; model scores without a fixed benchmark are not presented as performance claims.NextNext: establish a fixed benchmark dataset, add baseline/model comparisons and automate more of the data/validation pipeline.
01 / Verified metrics
5forecast time scales: hour / day / week / month / year
4missing-value strategies
4exports: CSV / HTML / TXT / ZIP
3cached artifacts per model configuration
These are repository-verifiable system capabilities, not cherry-picked model benchmark numbers.
02 / Architecture
Buoy Datastation, time, marine observations
Pipelineresample, missing data, smoothing, QA
LSTM2× LSTM + Dropout + Dense(1)
ProductRMSE / R / risk / downloads
03 / Risk & validation
Wave thresholdWarning 2.5, danger 4.0 for significant wave height.Wind thresholdWarning 10.0, danger 17.0 for wind speed.ValidationTemporal train/validation split with RMSE, correlation R and epsilon hit rate.CacheConfiguration hash reuses the Keras model, scaler and training history.
04 / Runtime UI
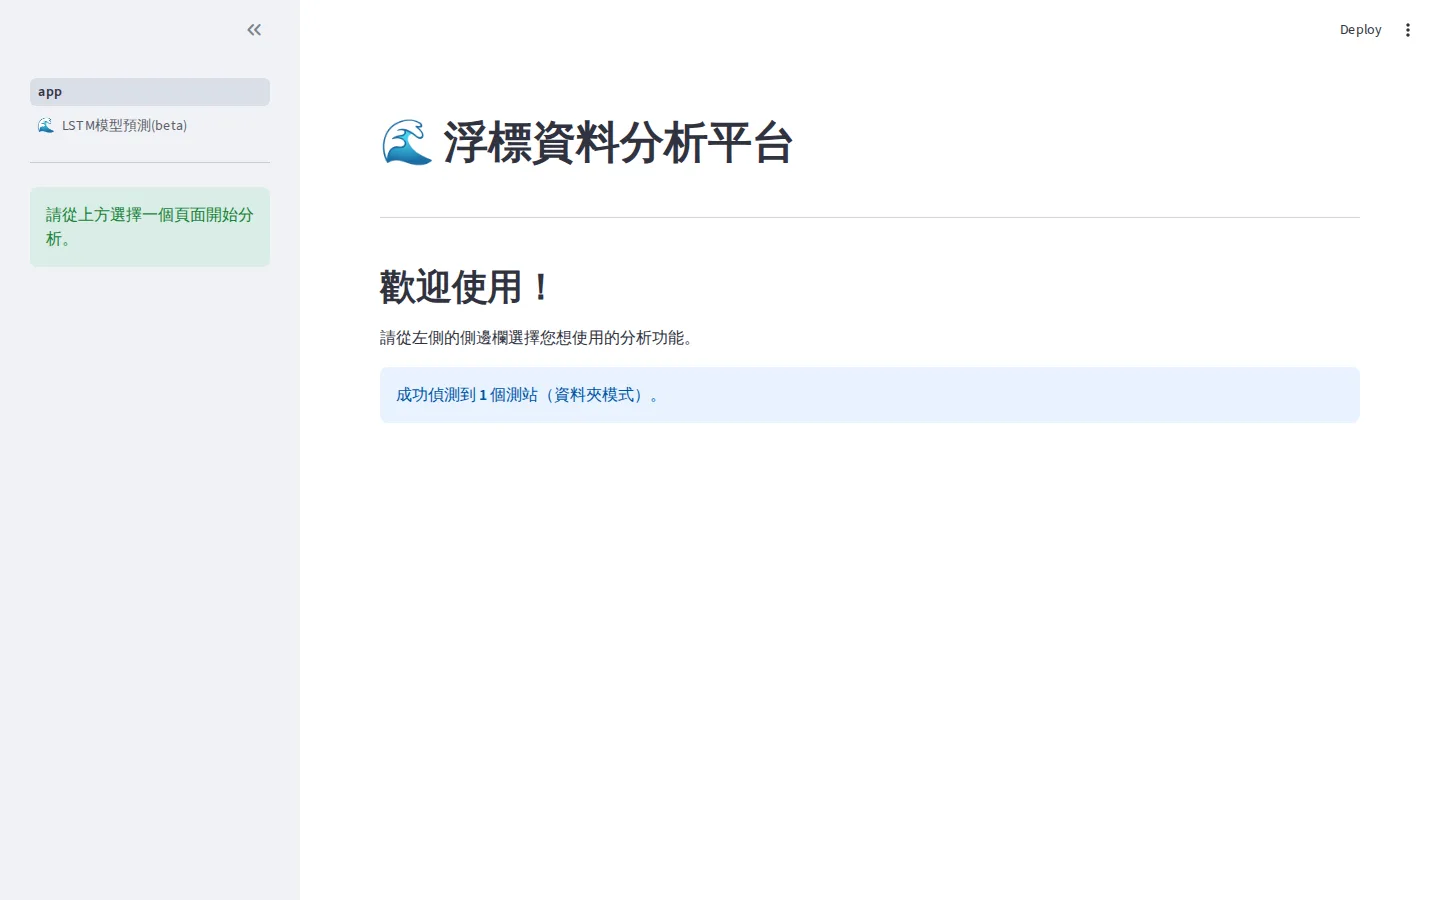
ACTUAL APP · CI CAPTURE
The real Streamlit runtime, not a recreated mockup.
This keeps the original app.py interface running against a minimal fixture dataset, so the product surface stays connected to the data and model workflow shown earlier in the case study.
streamlit · app.py · runtime
The original app.py is started in GitHub Actions and captured with Chromium using a minimal fixture dataset; this is the executable product surface rather than a design mockup.